Data visualisations
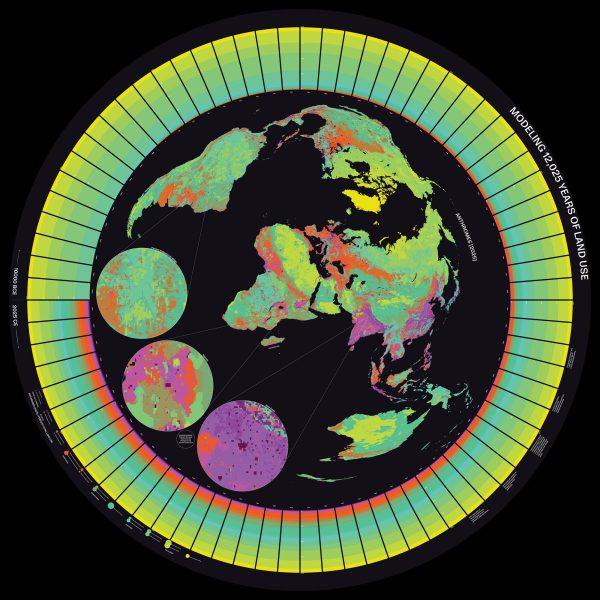
Synthetic memories feature in MoMA information design exhibition

Massive Attack stage graphic creates “illusion of data being harvested” from audience
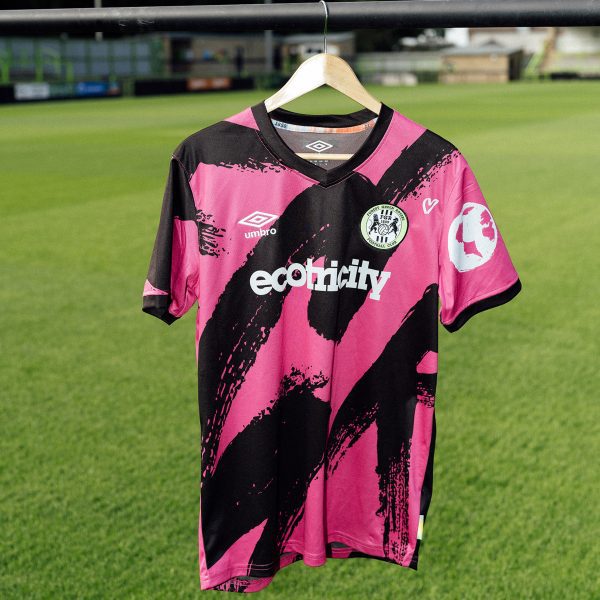
Climate change graphs hide in Forest Green Rovers football kit
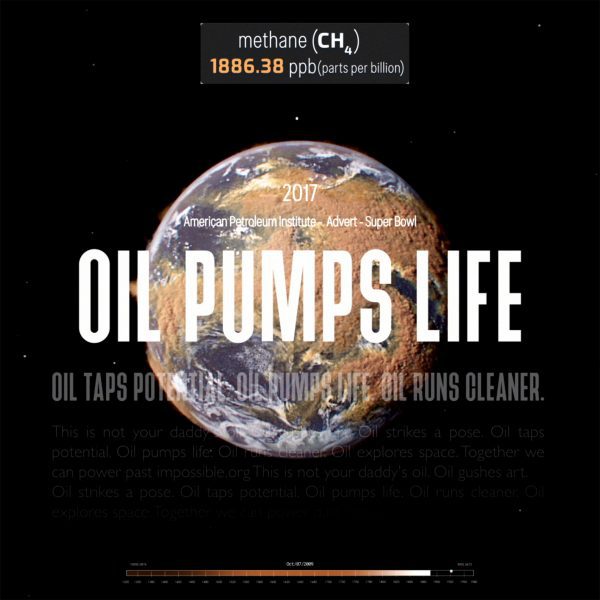
Beatie Wolfe visualises oil industry “disinformation” in Smoke and Mirrors video

UCL researchers translate endangered languages into 3D-printed objects
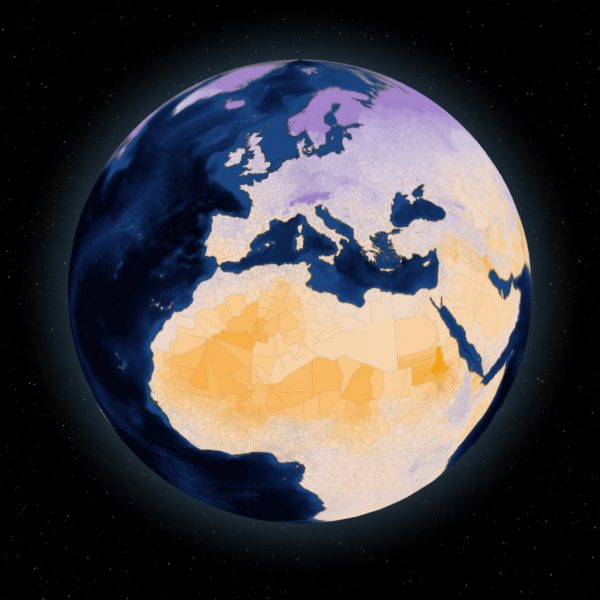
Human Climate Horizons tool projects impact of global heating on each nation

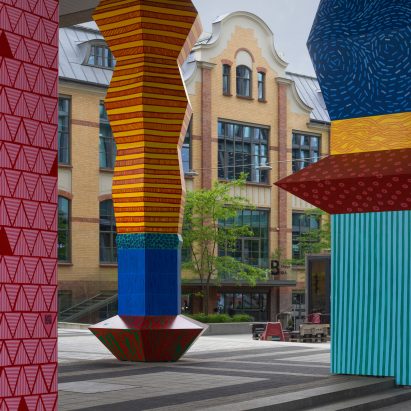
Liverpool’s rising sea levels captured in Merseyside Totemy sculptures
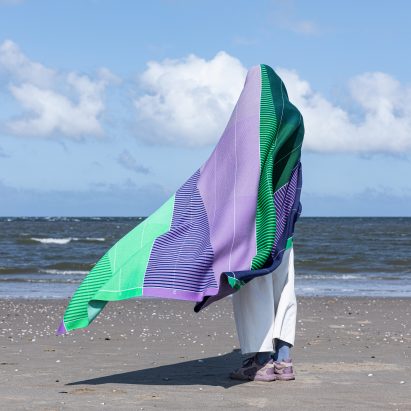
Raw Color’s Temperature Textiles wrap wearers in climate-change data
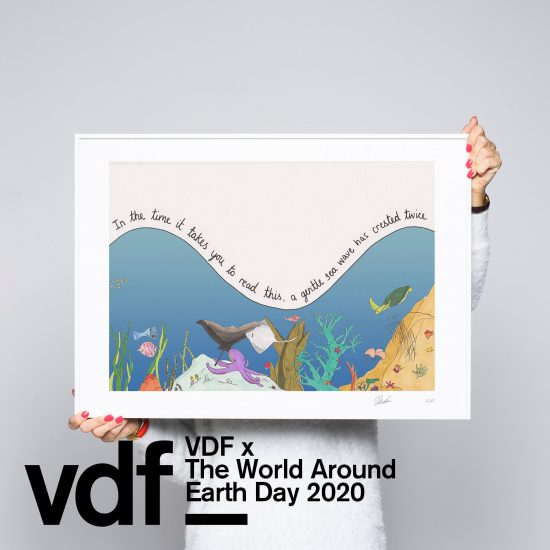
Mona Chalabi creates Stats to Help you Breathe illustrations to take people’s minds off coronavirus
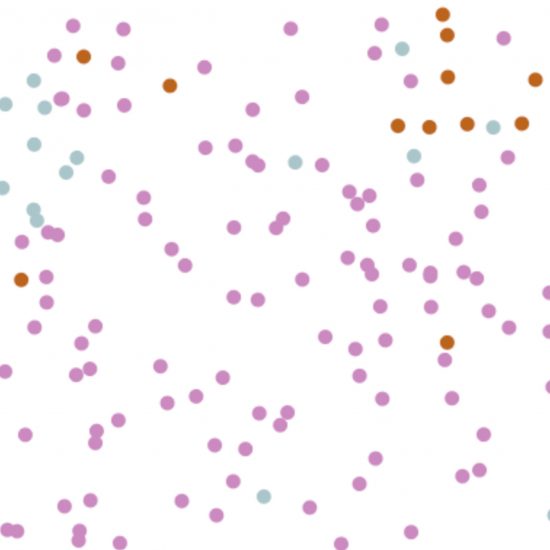
The Washington Post’s “simple simulations” showing how to slow coronavirus is its most popular story ever

Data is always a “fragment of a story” says information designer Giorgia Lupi

Inxects vest lets architects “feel” the health of a site like a sixth sense

“Data replicates the existing systems of power” says Pulitzer Prize-winner Mona Chalabi

“A deep understanding of humanity is way more complex than any algorithm” says Refik Anadol
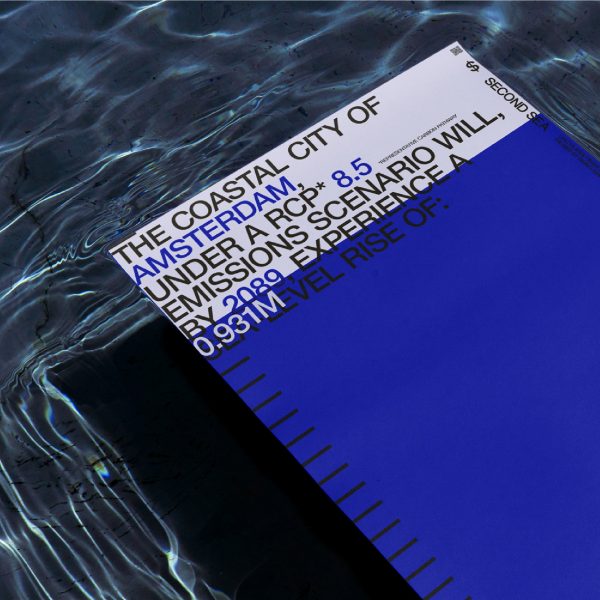
Second Sea calculator predicts damage to global cities from rising seas
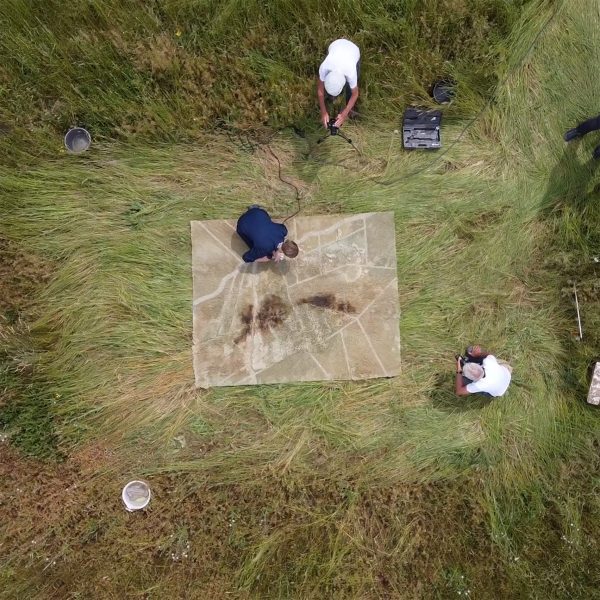
Burnt and shorn Dryland rug captures consequences of drought in the Netherlands
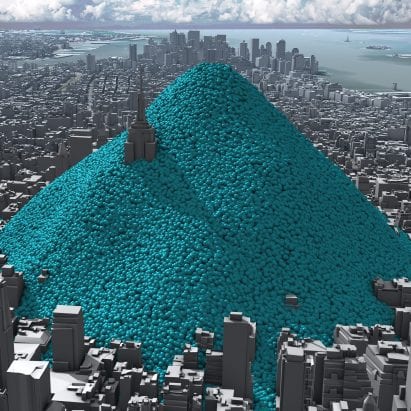
Blue bubbles helped “make the cause of climate change visible” say visualisers behind viral video
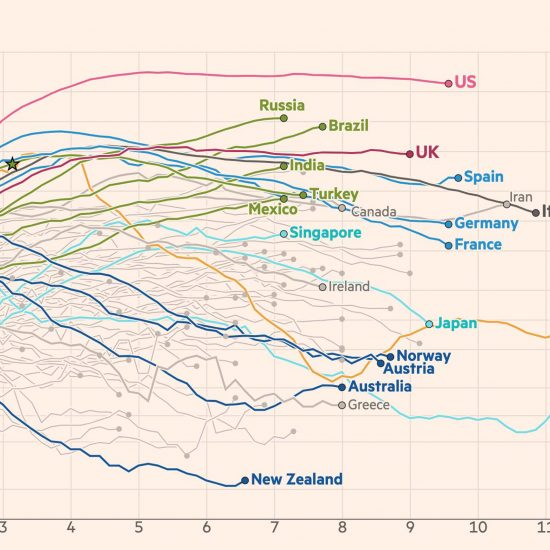
FT coronavirus updates “allow people to make an informed decision” says data visualisation journalist
Viral animations explaining the importance of social distancing show how “effective design can explain things” during coronavirus pandemic